
Mississauga Real Estate Market Snapshot – September 2026


Mississauga’s housing market moved into fall with solid activity in September 2026, with 468 homes sold across $435,052,745 in total dollar volume — an average price of $929,600 and a median of $868,000. With 1,371 new listings entering the market and 2,408 active listings citywide, buyers across all price points are entering the fall season with genuine selection and healthy negotiating room. Here’s the full breakdown of what moved in Mississauga last month.
Mississauga Real Estate Market Statistics – September 2026
| Property Type | Sales | Dollar Volume | Avg. Price | Median Price | New Listings | Active Listings |
|---|---|---|---|---|---|---|
| All Home Types | 468 | $435,052,745 | $929,600 | $868,000 | 1,371 | 2,408 |
| Detached Homes | 196 | $251,951,542 | $1,285,467 | $1,219,000 | 589 | 919 |
| Semi-Detached Homes | 72 | $62,651,600 | $870,161 | $865,000 | 142 | 202 |
| Townhomes | 13 | $12,740,480 | $980,037 | $898,000 | 50 | 68 |
| Condo Apartments | 122 | $61,023,448 | $500,192 | $432,500 | 382 | 831 |
Detached Homes for Sale in Mississauga
Detached homes led Mississauga’s September market with 196 sales generating $251,951,542 in volume. The average price of $1,285,467 sits above the median of $1,219,000, with premium sales in neighbourhoods like Mineola and Lorne Park continuing to lift the top end. With 589 new listings and 919 active, detached buyers have the deepest pool of inventory in the city — a well-supplied fall market with meaningful room to negotiate.
Semi-Detached Homes for Sale in Mississauga
Semi-detached homes remained active with 72 sales totalling $62,651,600, at an average of $870,161 and a median of $865,000. The near-identical figures confirm highly consistent and predictable pricing across the segment. With 142 new listings and 202 active, semi-detached continues to offer a reliable middle-tier option for buyers stepping up from condos without reaching detached price levels.
Townhomes for Sale in Mississauga
Townhomes were Mississauga’s smallest segment by sales in September, with just 13 transactions generating $12,740,480 at an average of $980,037 and a median of $898,000. The wider gap between average and median reflects a mix of product types, with some higher-end units lifting the average considerably. With only 50 new listings and 68 active, townhome supply stays lean — well-priced listings in this category continue to move faster than broader market conditions suggest.
Condos for Sale in Mississauga
Condo apartments recorded 122 sales and $61,023,448 in volume, with an average price of $500,192 and a median of $432,500. The notable spread between average and median signals a cluster of premium units pulling the top end up, while the majority of transactions clustered well below. With 382 new listings and 831 active — by far the deepest inventory in the city — condos remain Mississauga’s most accessible entry point and give first-time buyers, downsizers, and investors the strongest negotiating leverage this fall.
Homes for Rent in Mississauga
With a citywide median of $868,000 across all property types, renting remains a practical way to explore Mississauga’s diverse neighbourhoods — from Port Credit and Streetsville to Erin Mills and City Centre — before committing to a purchase in the fall market.
Final Thoughts
The Mississauga real estate market in September 2026 recorded 1,371 new listings brought to the MLS® system. Mississauga maintained a balanced market position with a Sales-to-New-Listings Ratio (SNLR) Trend of 36.5%. With approximately 4.8 months of inventory available, market conditions remain stable, offering healthy negotiating room and strong choices for prospective buyers entering the fall season.
Ready to explore what’s available right now? Browse all Mississauga homes for sale, or visit The Halton to explore listings across the wider Halton region.
Sources: Toronto Regional Real Estate Board (TRREB) — Market Watch, September 2026
Disclaimer: The market statistics and information provided in this blog are intended for general informational purposes only. Figures may change as data is updated and should not be relied upon as legal, financial, or investment advice.
You might also like

Mississauga Real Estate Market Snapshot – September 2026
Last Updated Oct 9, 2026

Oakville Real Estate Market Snapshot – September 2026
Last Updated Oct 9, 2026
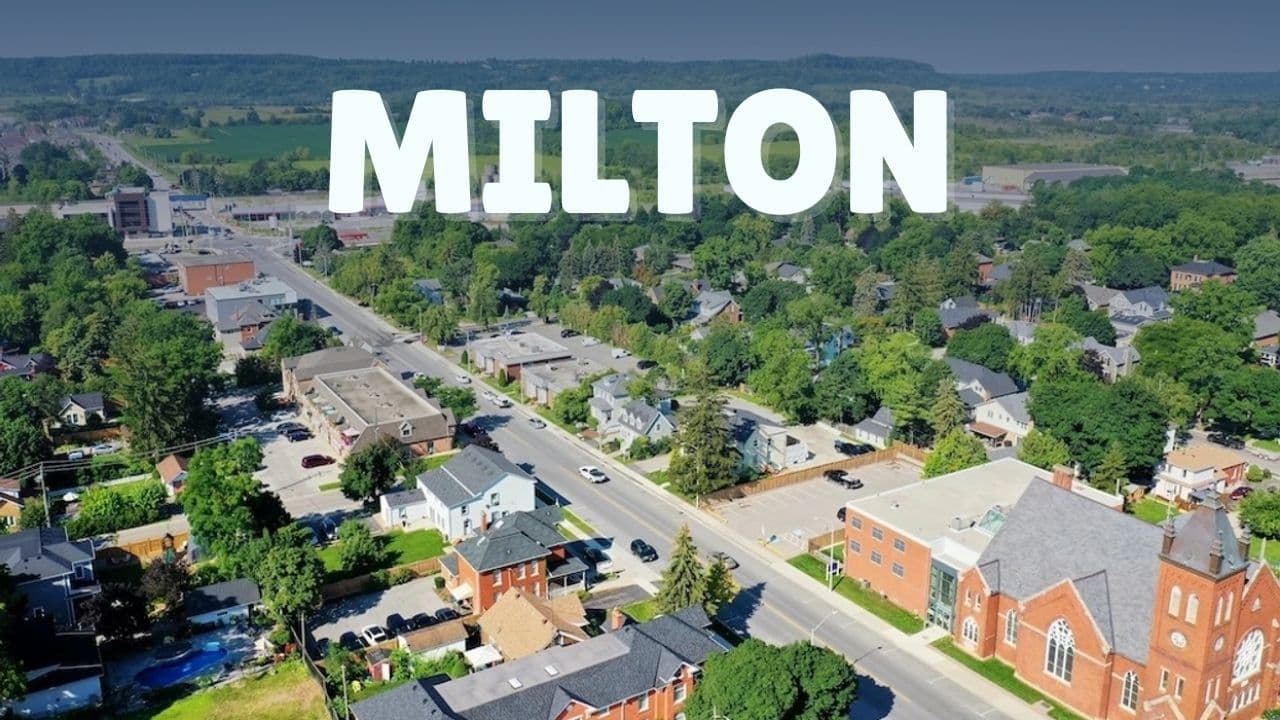
Milton Real Estate Market Snapshot – September 2026
Last Updated Oct 9, 2026

Burlington Real Estate Market Snapshot – September 2026
Last Updated Oct 9, 2026